Introduction
![]()
Calculate what to build next. Plan, rate and prioritize features and deliver more value to your customers with each release.
Do you feel overwhelmed by the incoming feature requests? Do you struggle with the feature prioritization and you don't know what should your team build next?
Feature Score for JIRA will help you to build a product pipeline with prioritized features based on your Key Business Metrics. This add-on provides an easy to configure custom field, what you can assign to any Product, Project or Issue to help Product/Project Managers make better decisions.
- Create score custom field for every feature you want to rank
- Customize your metrics, value range and weights easily
- Prioritize features based on your Key Business Metrics like demand, traffic, impact, cost, effort, testability, etc.
- Measure and analyze the value you deliver to your customers with each release
- Reduce uncertainty and make better decisions
Don't know how to start? Check out our best practices here.
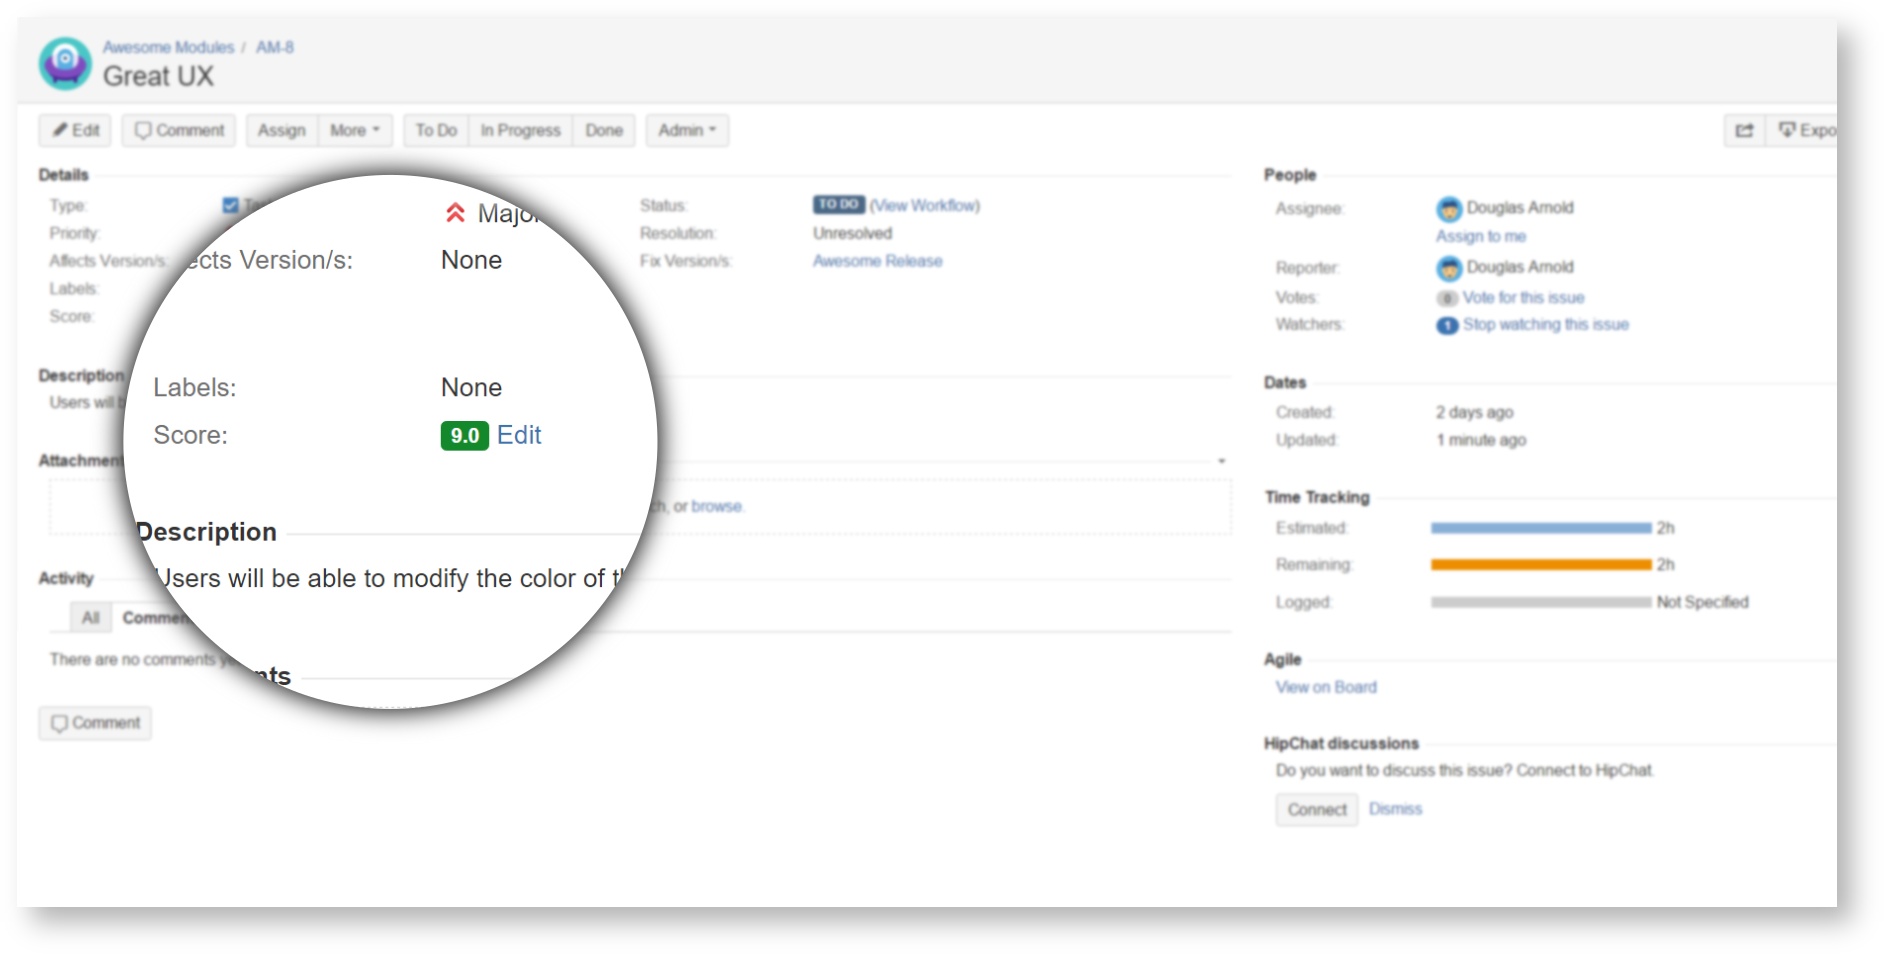
See the value of the feature immediately
This plugin adds a custom field type that allows you to immediately see your feature's value on the Issue screen. The score will be calculated based on the configured equation.
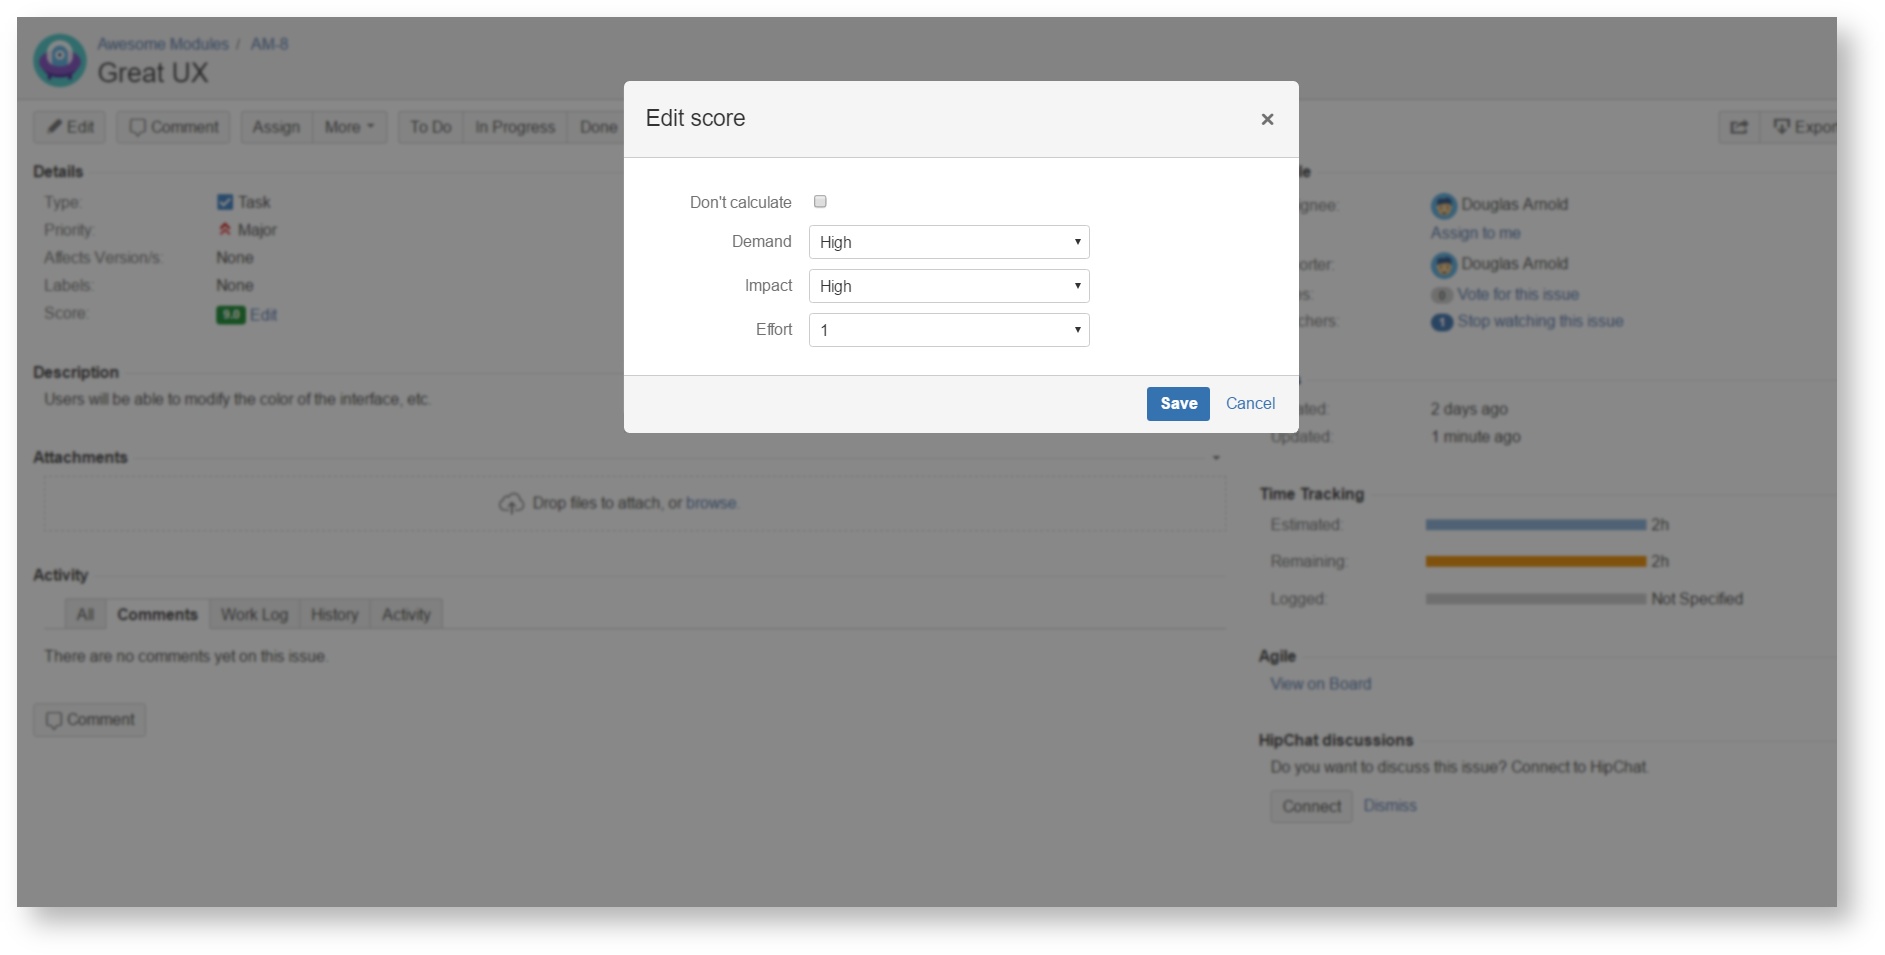
Rate the feature with ease
Rate features easily with your configured key parameters to get their scores. This score will determine the value of your feature based on your business metrics.
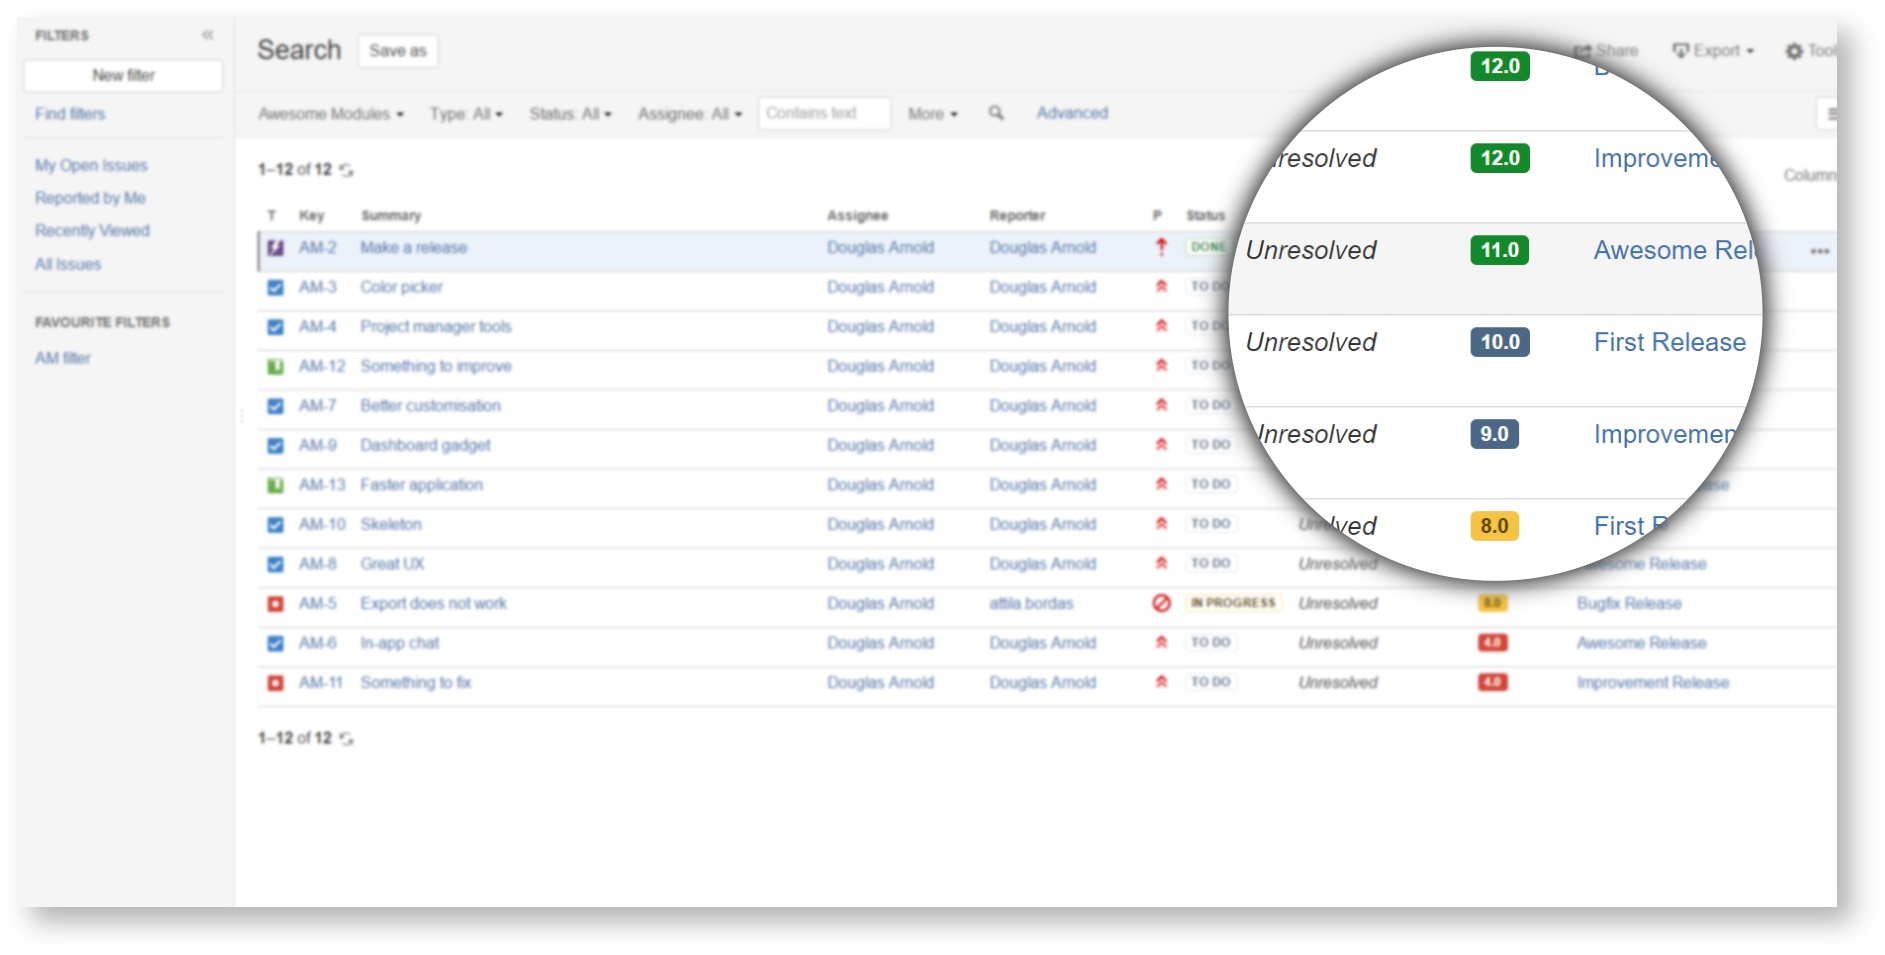
Build a product pipeline
Prioritize issues in your backlog based on your feature scores and plan your next release with maximum value.
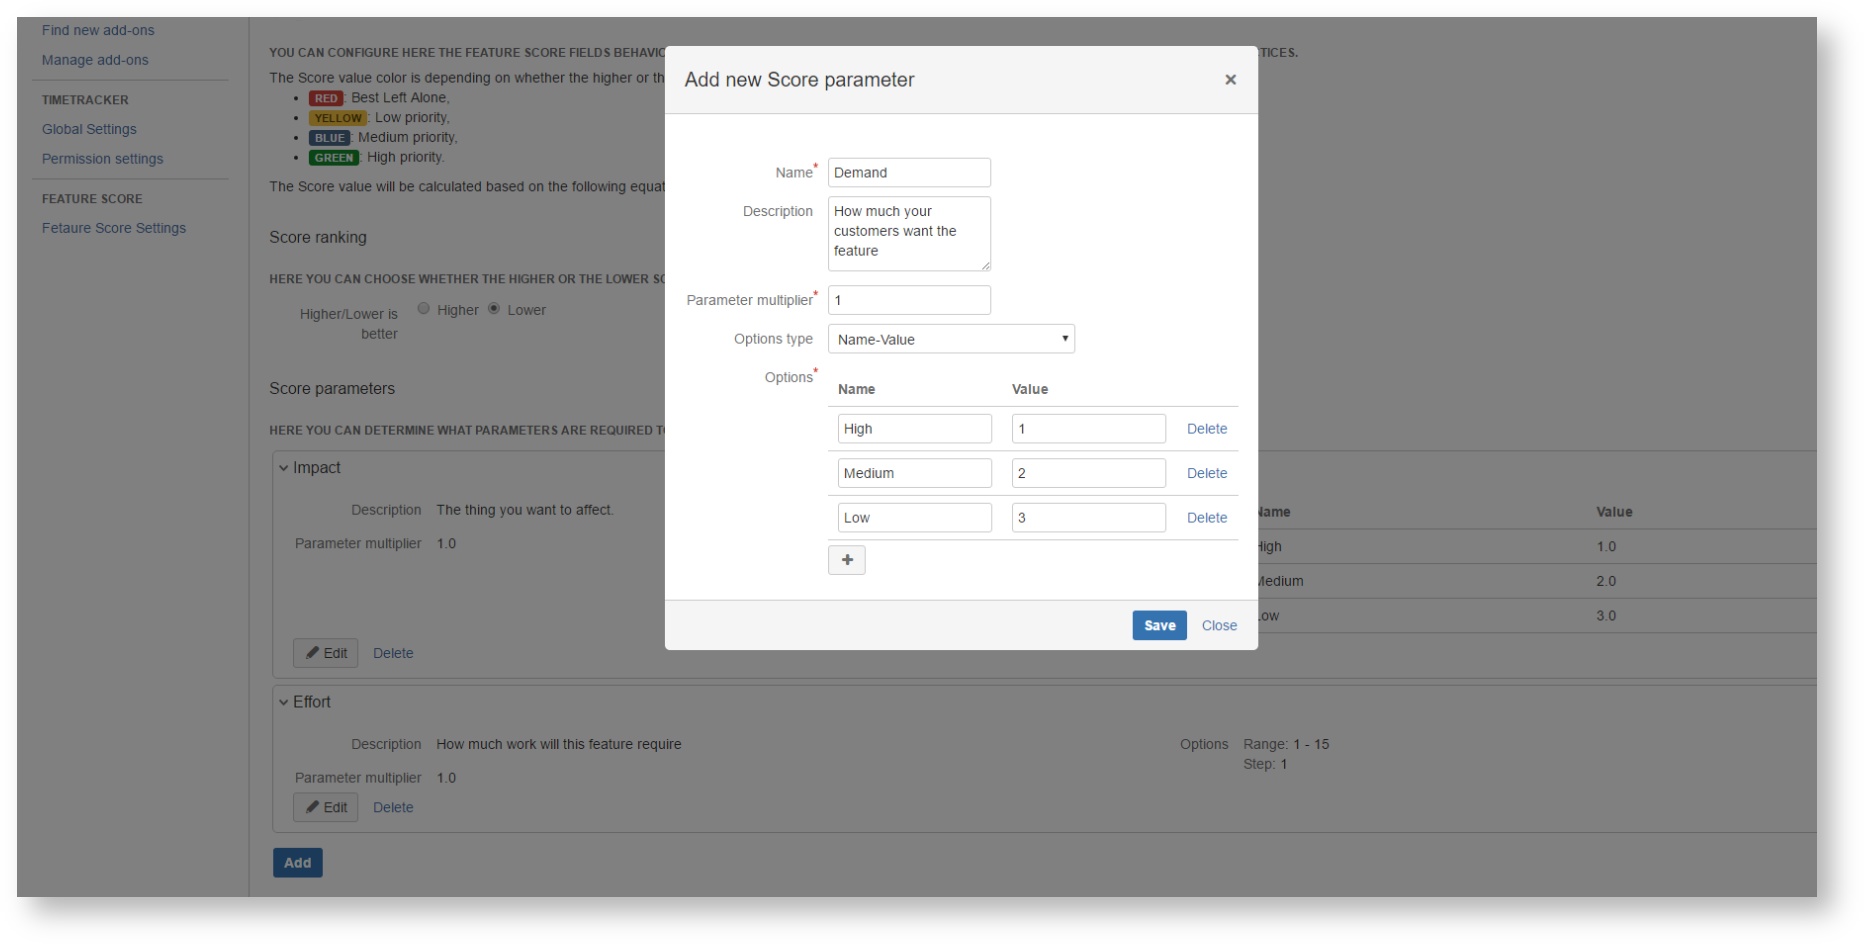
Customize your score metrics easily
You can easily configure your feature score custom field by adding any number of parameters such as name-value pairs or as value range with weights. Being a simple custom field means that you can decide which project or product you want to use the feature score.
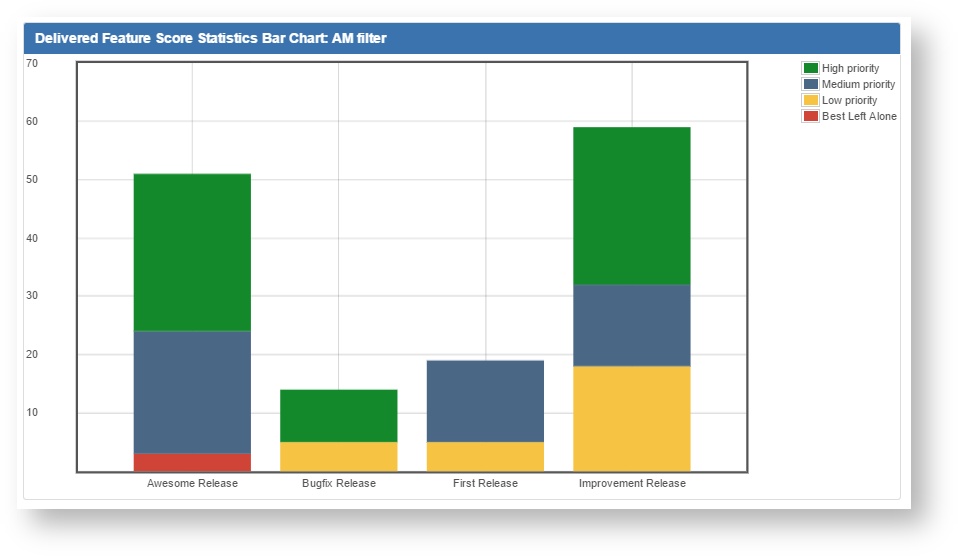
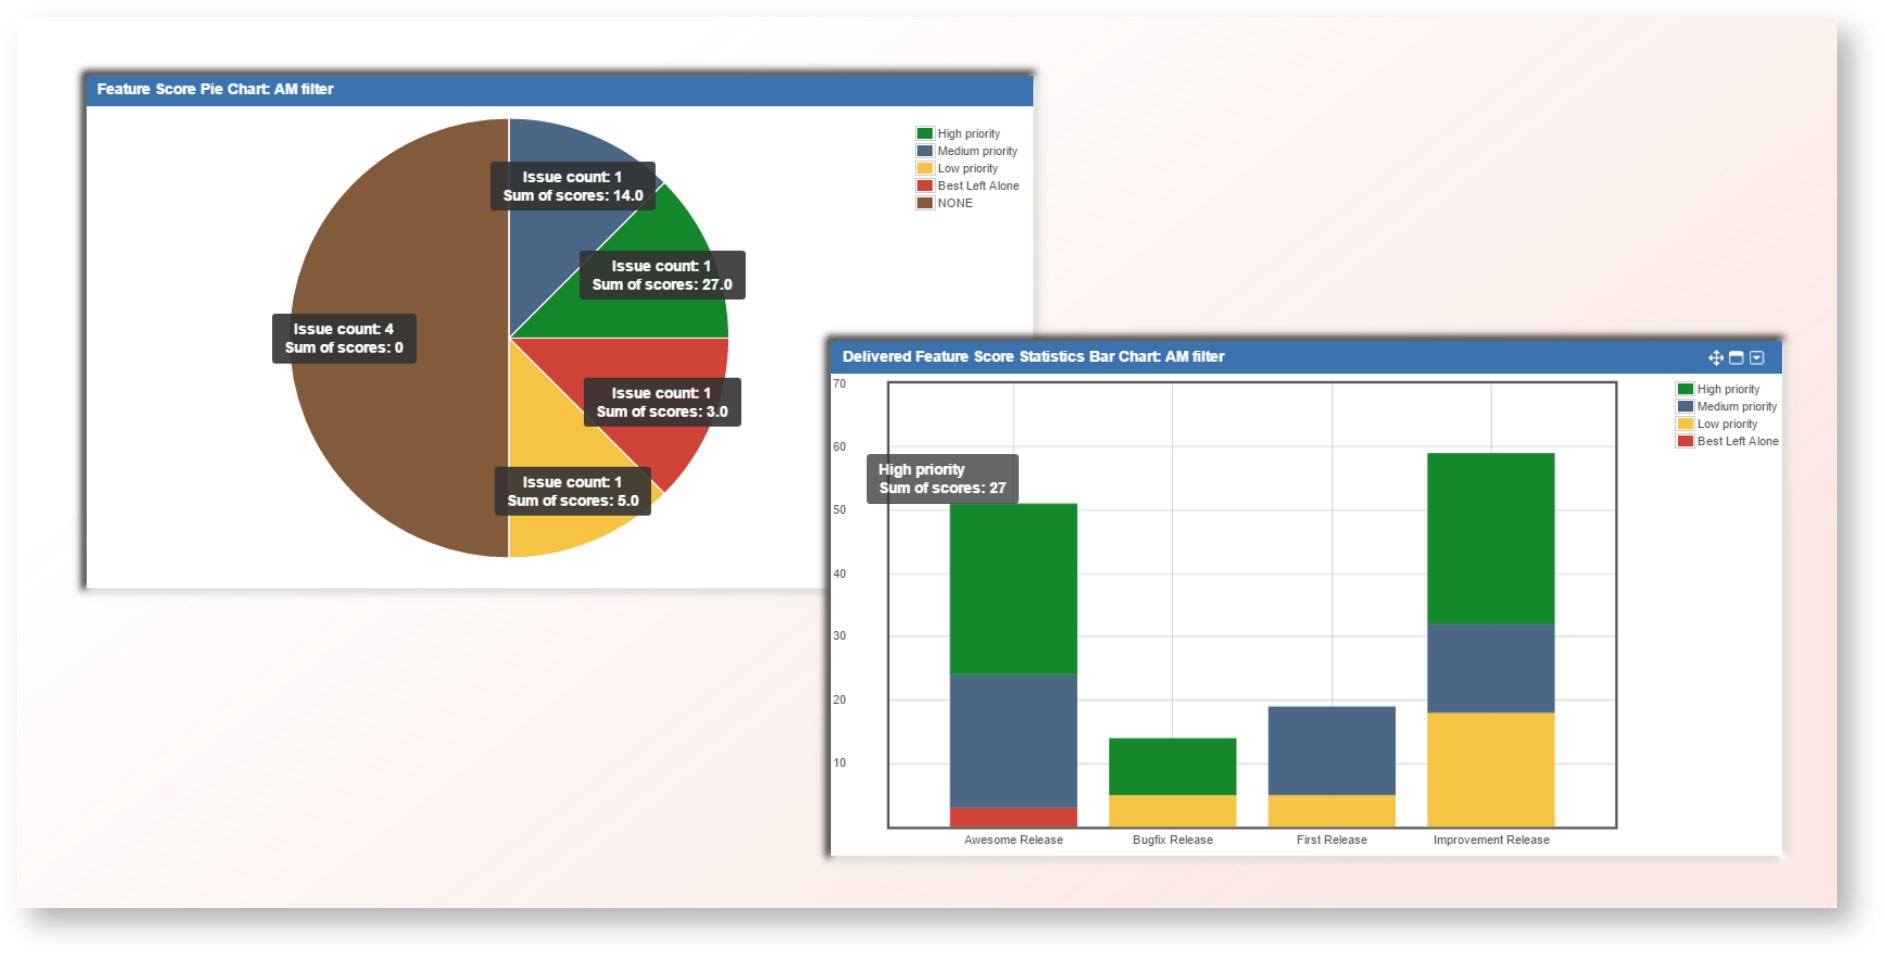
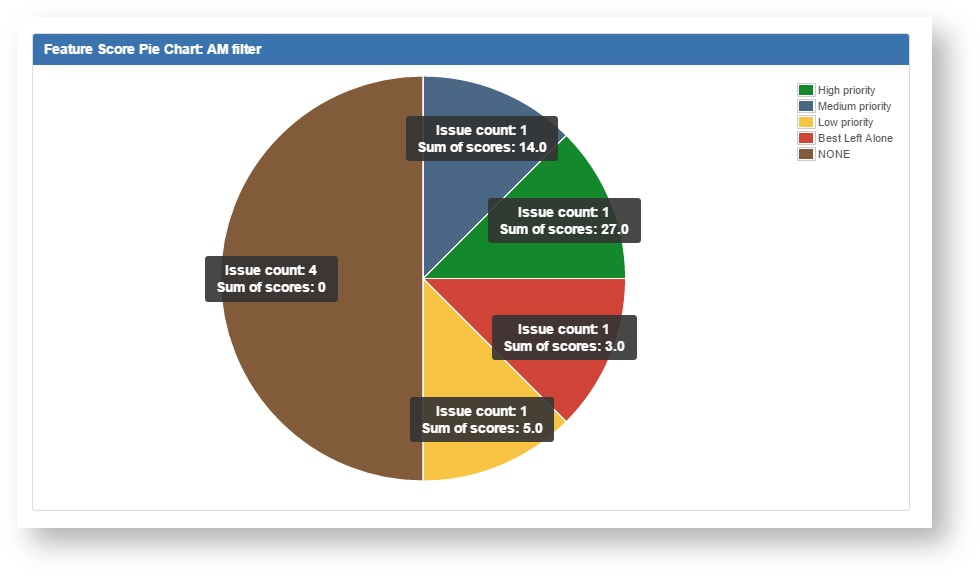
Measure and analyze the value you deliver
Add gadgets to your dashboard to measure and analyze how much value you deliver with each release.
Gadgets
Feature Score Pie Chart: Displays the number of issues and score points in each category for a selected Feature Score custom field and a filter as a pie chart.
Delivered Feature Score Statistics Bar Chart: Displays the sum of score points in each version for a Feature Score custom field and/or saved filter as a bar chart.