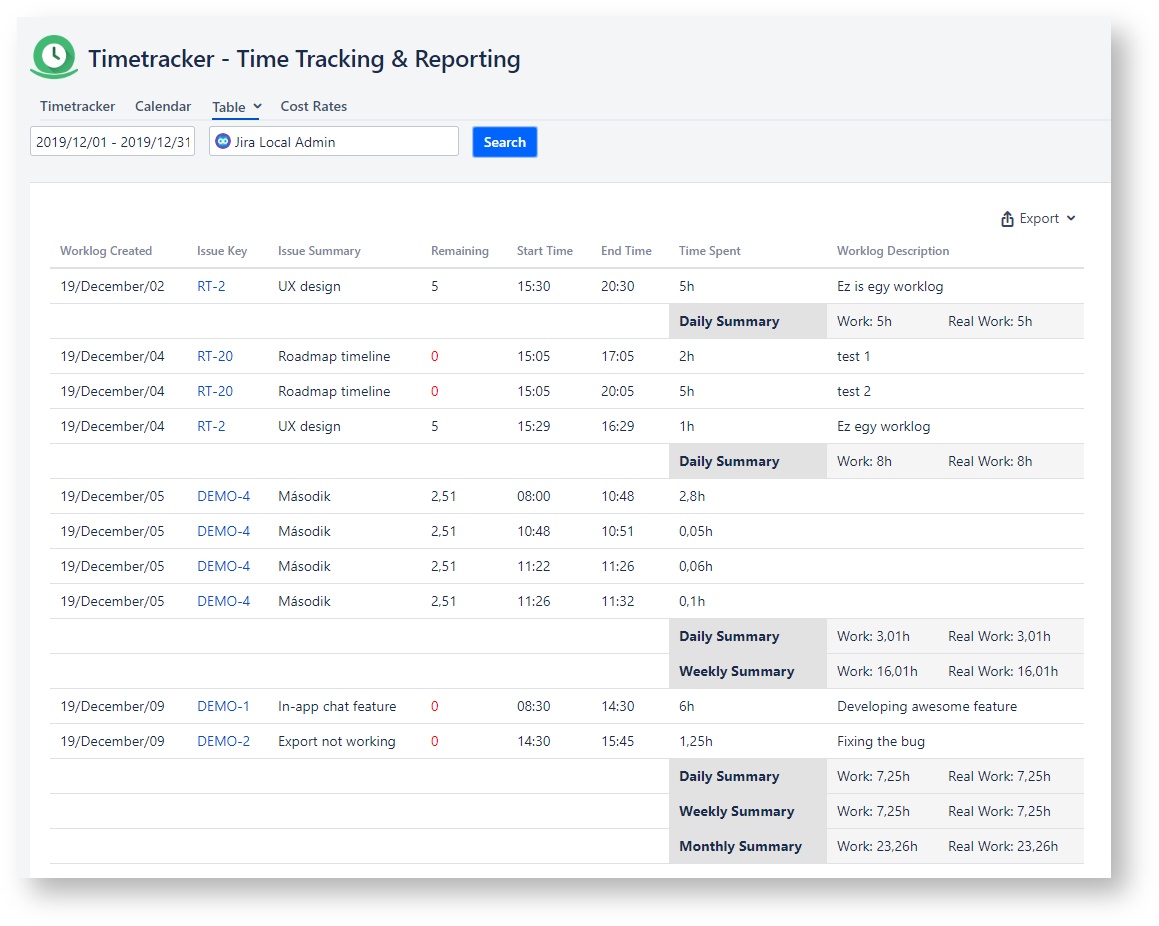
Table Report provides a solution that will let you view the worklogs in a structured and summarized form. The columns cannot be changed and are as follows: Worklog Created, Issue Key, Issue Summary, Remaining, Start Time, End Time, Time Spent, Worklog Description.
After each day/week/month there is a summary row that shows the total of the worklogs for the interval.
| Info |
|---|
| The "Real work" field does not count the projects defined at the Non-Working issues setting. |
How to use
- You can select a user. The default user is the currently logged in user.
- On the report page, you can set a date range of the report by setting the start and end date of the interval with the Date Range Picker.
- The date in the From field is considered from 00:00, whereas the date in the To field is considered till 23:59.
- By default, the value of the From field is a date being a month earlier than the current date, while the value of the To field is the current date.
- The query is executed after pressing the Create Report button.
Export to Excel
Table Report enables you to export your search results to Microsoft Excel.