| Info |
|---|
On this page we will show you how Issue Score can help in making important risk decisions. |
With the help of Issue Score, you can manage and visualize your risks. For example, you can define:
- an Issue Score field as Risk Index,
- A Key-Value field as Probability,
- A Key-Value field as Impact.
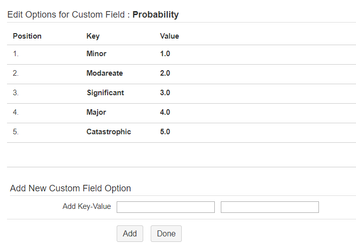
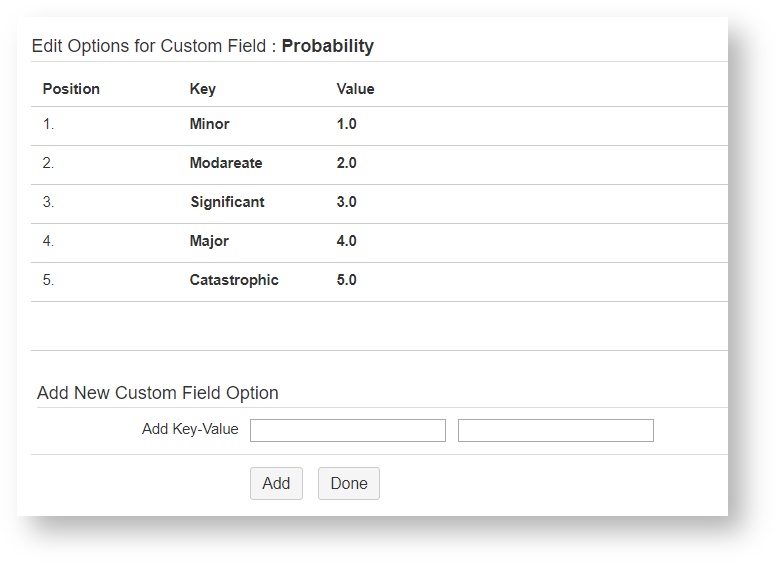
For the Probability Key-Value field you can add the following options:
- Catastrophic - 5
- Major - 4
- Significant - 3
- Moderate - 2
- Minor - 1
For the Impact Key-Value field you can add the following options:
- Certain - 5
- Likely - 4
- Possible - 3
- Unlikely - 2
- Rare - 1
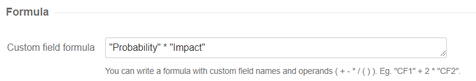
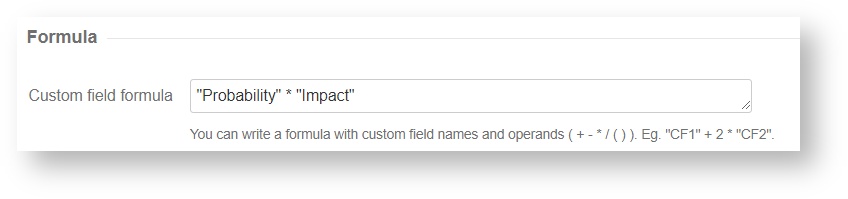
Now you should configure your Issue Score field as a Risk Index. You Score formula could be: Probability x Impact. The resulting risk matrix could be like this:
| x | Negligible -1 | Marginal - 2 | Critical - 3 | Major - 4 | Catastrophic - 5 |
|---|---|---|---|---|---|
| Certain - 5 | Medium (5) | High (10) | High (15) | Extreme (20) | Extreme (25) |
| Likely - 4 | Medium (4) | Medium (8) | High (12) | High (16) | Extreme (20) |
| Possible - 3 | Low (3) | Medium (6) | Medium (9) | High (12) | High (15) |
| Unlikely - 2 | Low (2) | Low (4) | Medium (6) | Medium (8) | High (10) |
| Rare - 1 | Low (1) | Low (2) | Low (3) | Low (4) | Medium (5) |
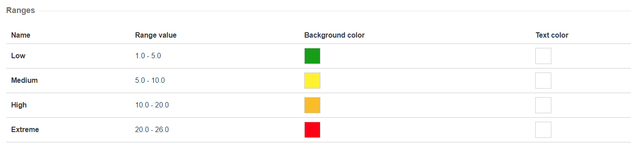
It's easy to see that you can define Issue Score ranges for your risk categories. With this, you will get instant visual feedback on your Issue Screen about the risk index.
- Low: 1 - 5
- Medium: 5 - 10
- High: 10 - 20
- Extreme: 20 - 26

If you enjoyed this article, try out Issue Score now!